Every February 14, all around the world, candy, flowers and gifts are exchanged between loved ones, all in the name of St. Valentine. But who is this mysterious saint, and where did these traditions come from?
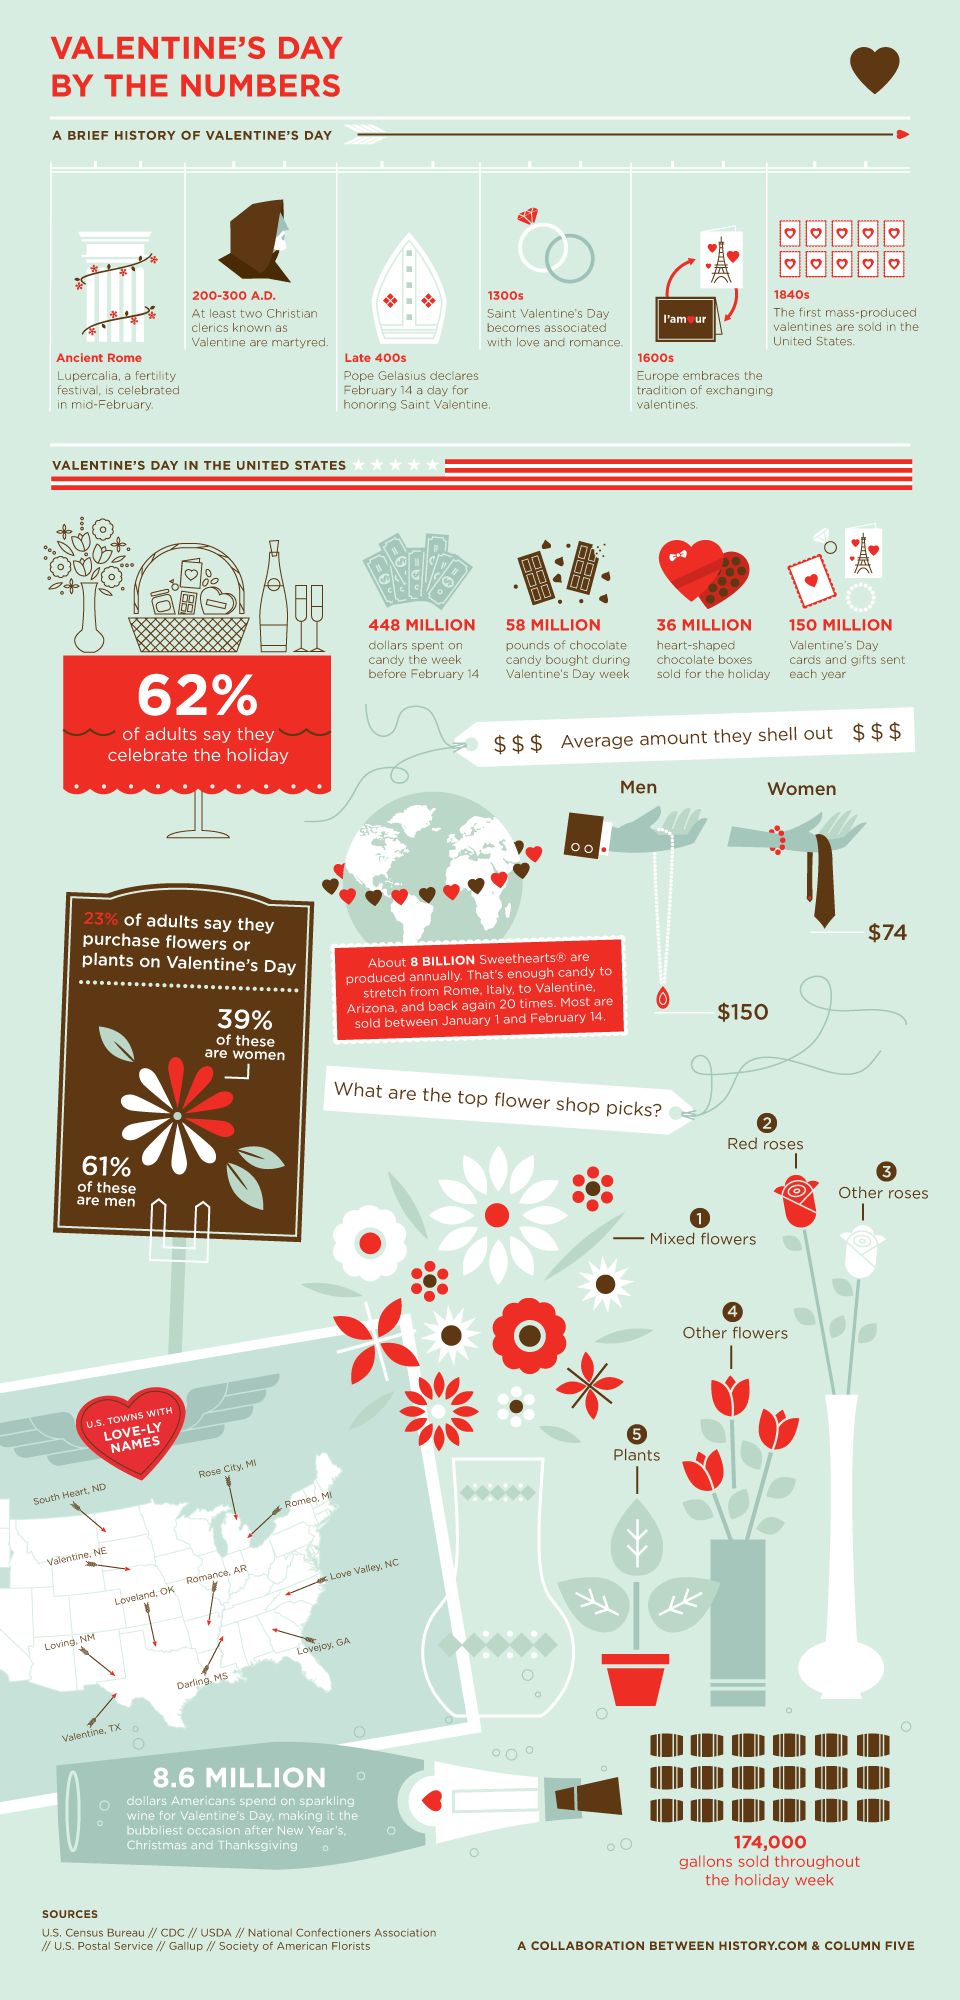
Find out about the history of this centuries-old holiday, from ancient Roman rituals to the customs of Victorian England through this beautiful infographic named “Valentine’s day by the numbers”.
It depicts the true facts of the history of the Valentine’s Day from the ancient Rome era to the 18th century. The infographic shows astonishing facts of different gifts presented to the loved ones like chocolates, cards to name a few in United States during Valentine’s Day.
Approximately 150 million Valentine’s Day cards are exchanged annually, making Valentine’s Day the second most popular card-sending holiday after Christmas. It also gives insights of people in percentages that spend moneys on flowers, card, and wine on this day.
Groom into this beautifully made infographic, and surprise your loved one by some gifts mentioned in it. Good Luck!!
Likes: The facts mentioned are informative while they are much more important for teenagers.
Dislikes: Arrangement the main issue and the history could be extended.
Infographic produced by History.com

Photo credit: shutterstock.com

