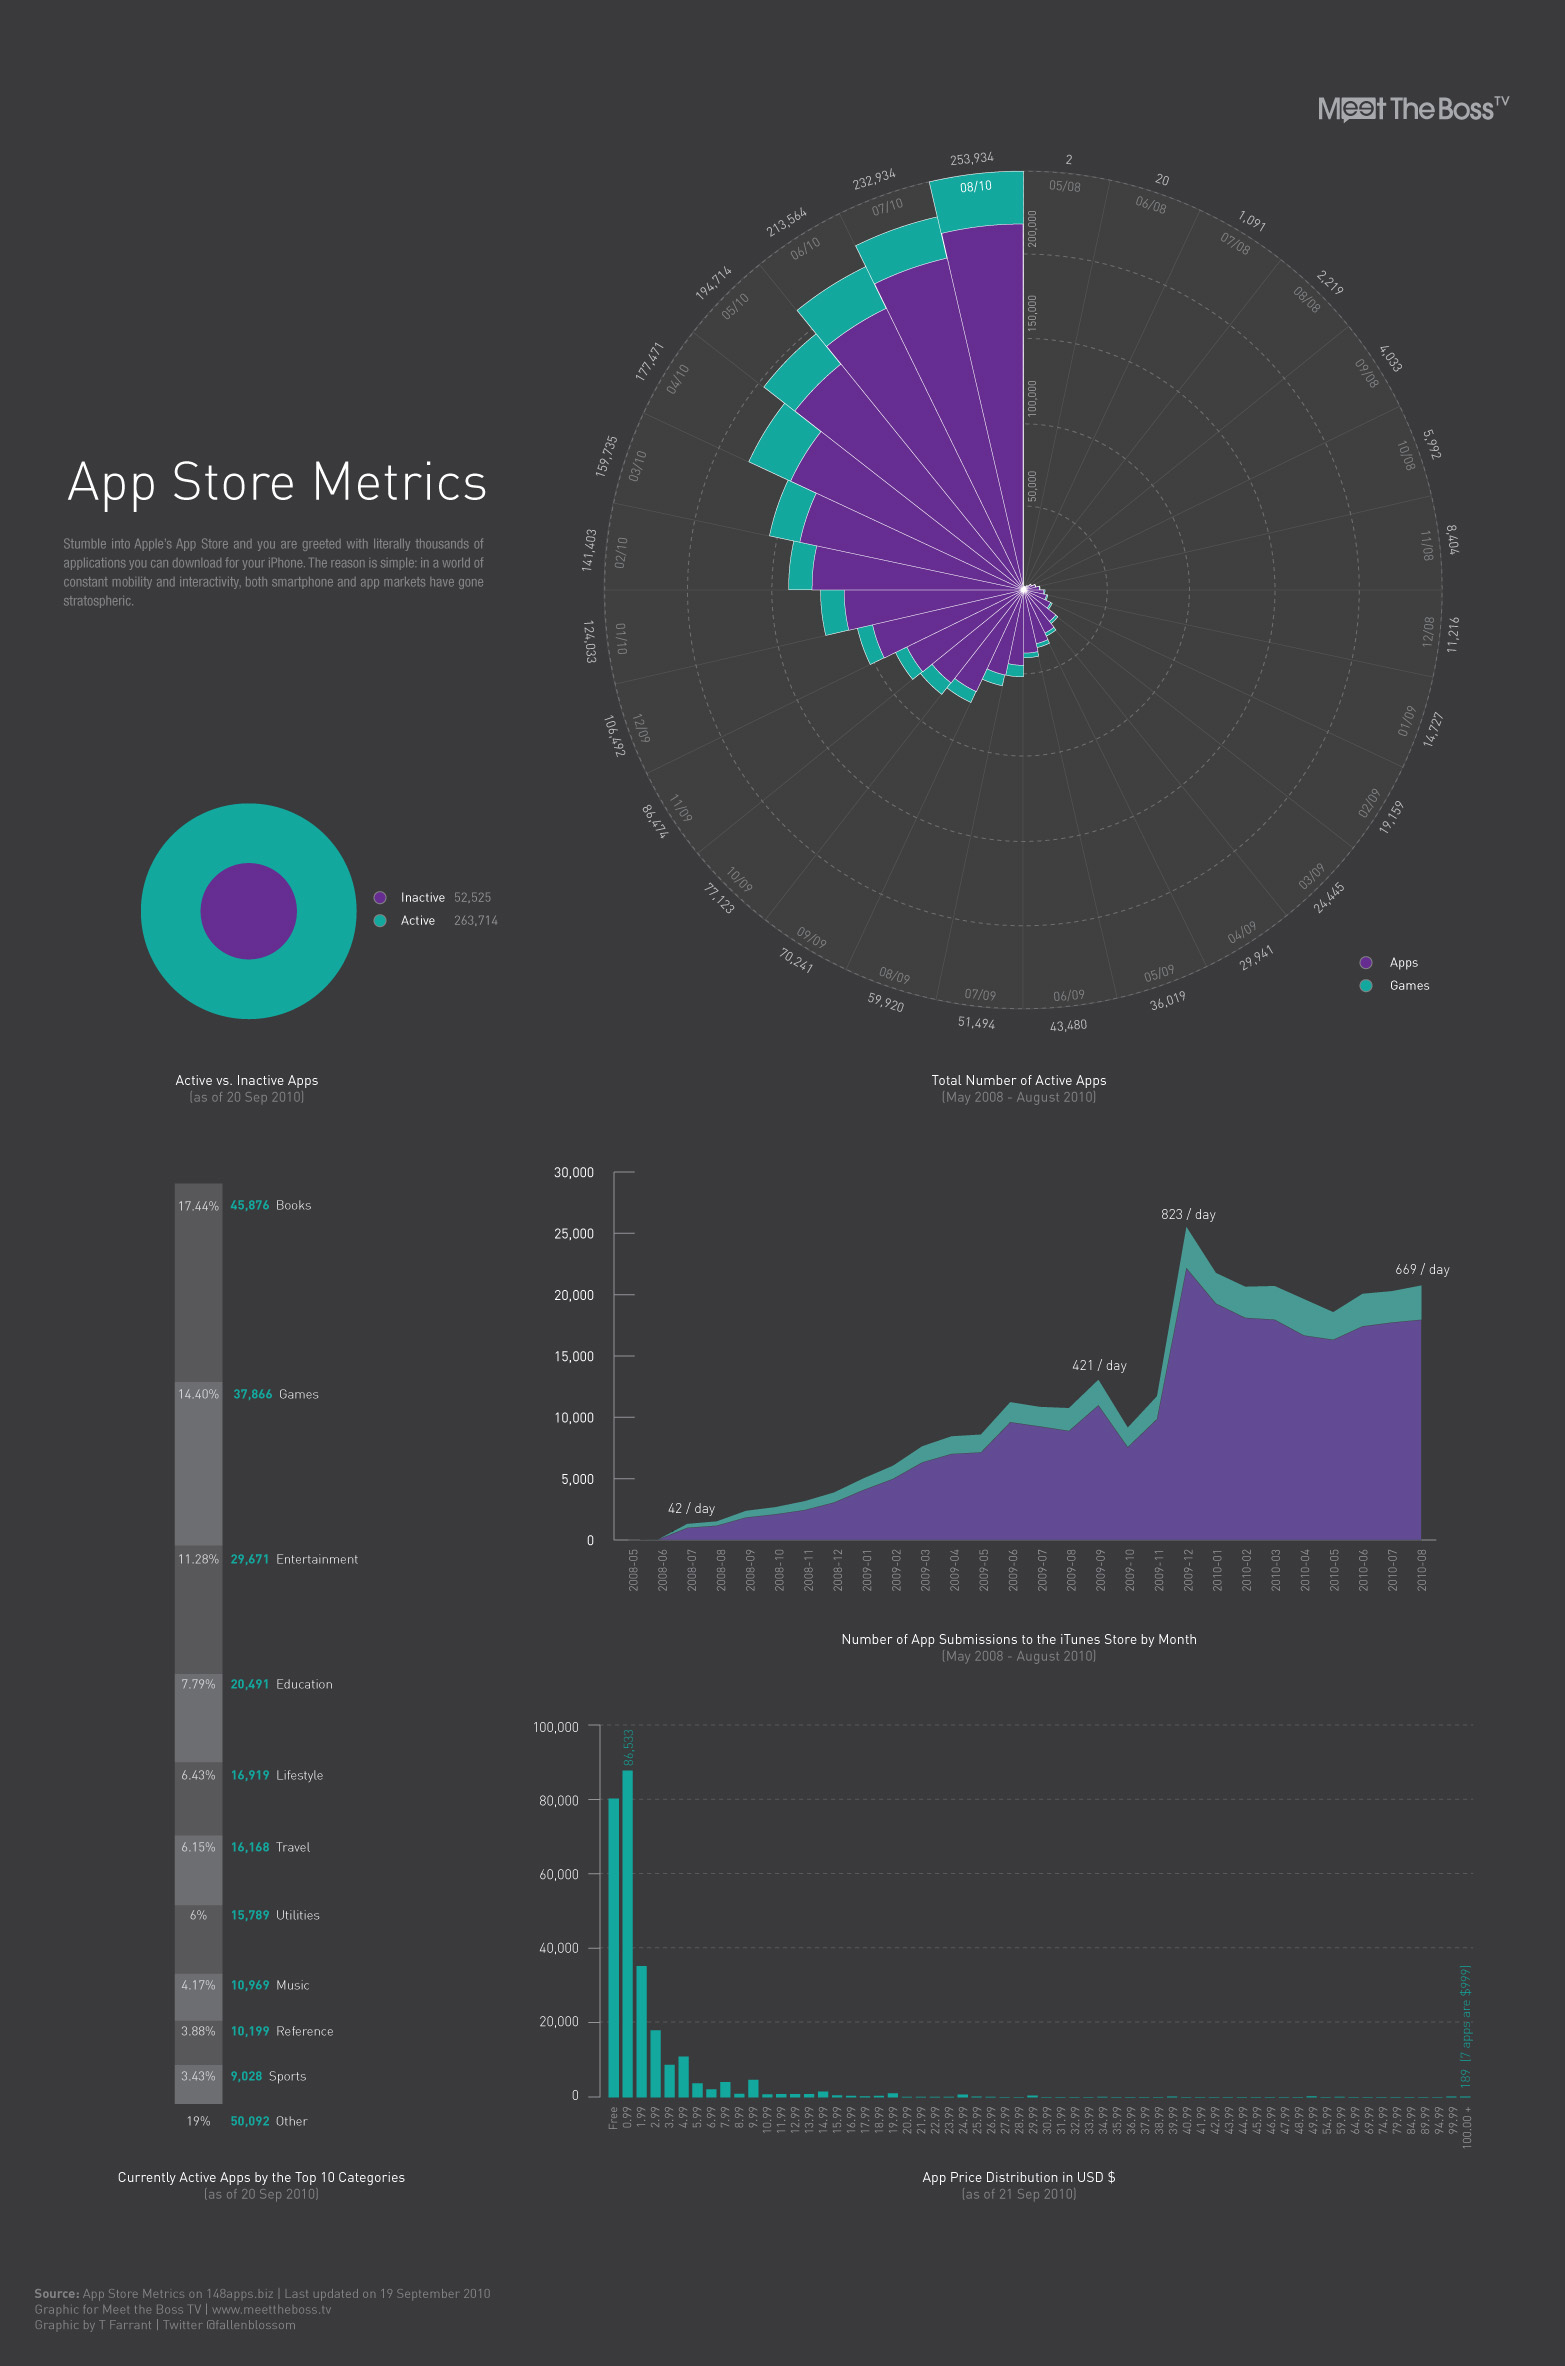
When you are in the App Store, there is not a kind of app which you wouldn’t find. Apart from the explicit ones, which are, of course banned. But beside that, each and every kind of app is available to you on the Apple’s App Store. Did you ever wonder which are the basic types of app which people download the most? The “App Store metrics” infographic is here to tell you all about it. It will give you the detailed information about which types of apps are the most downloaded.
Initially on this infographic you would see how the rise of the number of people has taken shape over the years, in the world of the app store. The app store market has boomed and the exact figures capturing this event have been shown in this infographic. But what is more interesting to note is that, with several thousands of apps and millions of users worldwide, there is still a huge list of apps lying inactive – this means people aren’t using them enough frequently. But still the number of apps lying inactive is less than the number of apps which are active, which is relieving but also obvious given the rate at which people use these apps.
Now there goes the percentage of apps which are contributed to in every section each month. You can see in this infographic the number of apps contributed to entertainment, to games, and so on.
Likes: Overall this infographic is pretty decently portrayed.
Dislike: The monotonous grey is probably the only bugger.
Click to enlarge
courtesy: static.intomobile.com

